
On 9 October 2026, about fifty contestants sat down at SSN for the IEEE Day edition of Clash of Progs and the backend I had built for them stopped answering. Bots kept fighting, the CPU stayed busy, and yet the leaderboard timed out, the Forge refused to save code and logins dropped. This post is the full diagnosis: what ran, what players saw, the six causes I found, how they fed each other, what I changed during the event, and the architecture the platform should have had.
What ran on the day#
Everything lived on one AWS instance, a c7i.2xlarge with 8 vCPUs in ap-south-1. Traefik terminated TLS and sent /api and /ws to a single game-server container and everything else to the Next.js frontend. The game server is one Uvicorn worker, one Python process, one asyncio event loop. That was deliberate: matchmaking queues, tournament sessions and WebSocket rooms are process-local memory, and WEB_CONCURRENCY is pinned to 1 in both compose files because a second worker would silently split that state.
The same process ran four jobs: the REST API, the WebSocket rooms, a ladder scheduler that launches rated six-bot matches in the background, and a plagiarism auditor that compares every saved bot against the others. Persistence was SQLite through SQLAlchemy and aiosqlite, in WAL mode, on a Docker named volume so that POSIX locking and shared memory behave. A backup task wrote a VACUUM INTO snapshot every 300 seconds.
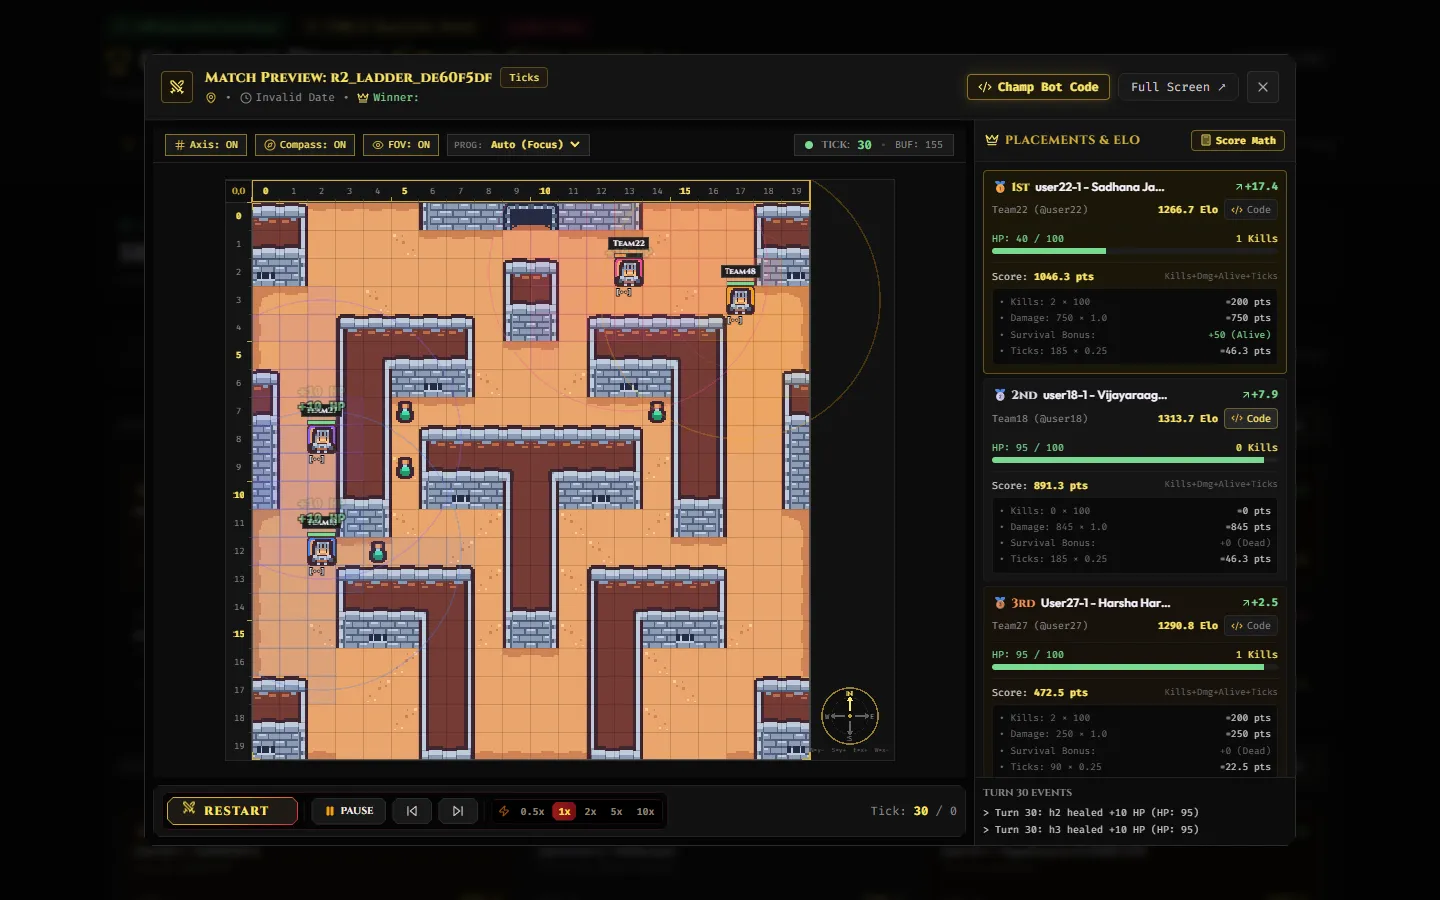
One match, from final tick to stall#
The paradox of the day was that matches kept completing while pages died. The reason is where a match touches the database. A match is loaded once, bot code runs tick by tick in sandboxed subprocesses, and the engine resolves turns in memory; SQLite is not involved while bots fight. The database is touched at the edges: before a match to read settings and bots, after it to settle ratings. So the CPU stayed at full tilt, and the fragile part was the few milliseconds at each end where all that traffic converged on one file.
elo_service.py and the routes it competed with. Press play or pick a step to walk through it.The shape of the day#
I have two records of 9 October: the instance's CloudWatch export (five-minute CPU, network and status-check samples) and the git history of every change I shipped while the event ran. Together they give a timeline. All times are IST.
CPU sat at 0.4 to 0.7 percent until about 10:30, then climbed as contestants arrived, reaching 12.4 percent at 12:00, with every sample from 11:40 to 12:05 above 8 percent. On an 8 vCPU instance, 12.5 percent is exactly one core, which is the signature of a single-threaded Python process pegged at 100 percent while seven cores idle. From 12:25 to 13:00 CPU fell to about 1 percent even though the box was still sending more than 30 MB of outbound traffic per five minutes at 12:35 and 12:50: users were being served, but no matches were being simulated. At 13:00 the sample jumped from 1.1 to 12.3 percent, and the day's highest sample, 17.75 percent, arrived at 13:20. CPU was back under 1 percent by 14:25. The status check never failed once. The machine was healthy; the process was not.
Cause 1: reads that wrote#
You learn here how a harmless-looking convenience turned browsing into a write load. get_current_user in backend/app/auth/security.py runs on nearly every authenticated route. Besides validating the token it recorded presence by updating users.last_seen_at and committing:
if not user_dt or (now_utc - user_dt).total_seconds() > 15.0:
    user.last_seen_at = now_utc
    try:
        await db.commit()
    except Exception:
        pass
The window was 15 seconds. With fifty contestants that is up to 3.3 write transactions per second from people who were only looking at pages, and each one needed SQLite's single writer slot at the same moment settlement and Forge saves wanted it. Worse, the commit ran on the request's own session without the application lock, so it queued at the file level. The except: pass hid the failure, so a locked commit looked like a slow request, not an error. At 13:23 I widened the window to 60 seconds and replaced the silent pass with a rollback; at 13:30 I deleted the write entirely.
The read side of the same traffic was heavy too. If each contestant had three tabs open, the navbar alone polled /api/settings/public every 5 seconds from 150 tabs, about 30 requests per second, with a 15 second settings cache behind it. When that cache expired, every request in flight reloaded it at once; at 13:51 I made the refresh single-flight and the TTL 30 seconds. The bot list ran a ladder-stats query per bot, and the replay loader issued a query per match; I batched the latter with IN (...) at 12:04.
forensics/test2_write_contention.py reproduces: unserialised writers collide at the file, and the loser fails after its busy timeout.How SQLite serialises writes, and why it fit#
This section is the mechanism, because every later cause depends on it. SQLite is a library, not a server. Every connection in the process opens the same file and coordinates through file locks and, in WAL mode, a shared-memory index next to the file. Two rules matter. First, there is exactly one writer at a time: a write transaction takes the database's write lock, and a second writer either waits for it or fails. Second, in WAL mode readers do not block that writer and it does not block them. Each reader pins a snapshot, a position in the log, and reads the main file plus whatever frames of the log were committed up to that position.
When a second writer arrives, SQLite does not queue it fairly. With busy_timeout set, the connection retries in a sleep loop for up to that many milliseconds and then raises SQLITE_BUSY, which Python surfaces as database is locked. There is no fairness and no ordering, so a steady stream of short writes can starve one waiter while others pass. There is also a trap for read-then-write transactions: if a connection has read from a snapshot and another writer has since committed, upgrading to a write fails immediately with a busy error that busy_timeout cannot cure, because waiting does not make the snapshot fresh.
This is why SQLite was a reasonable choice. The prototype was one process, one developer and a handful of requests per second. A write commits in well under a millisecond, there is no network hop, backup is one file, and there is nothing to operate. The September load tests I ran on this stack were healthy: a cached leaderboard served 4,309 requests per second. SQLite is excellent when write contention is rare, and I built the platform assuming it would stay rare. An event changes that assumption in an afternoon: fifty people editing, saving and polling, plus a scheduler writing results, all at once.
bots columns and inserts into match_results; a champion swap updates users; the leaderboard aggregates match_results per bot. Row counts are from the production snapshot.Cause 2: a reader that never closed#
WAL mode gets its concurrency from an append-only log. Writers append frames to clash_of_progs.db-wal; a checkpoint later copies them into the main file and, once no reader still depends on the log, resets it. The catch is the last clause. While any reader holds a snapshot older than the newest frames, the log cannot be reset, and a wal_checkpoint(TRUNCATE) returns busy=1 with nothing written back. Readers also pay for a long log: every page lookup consults the WAL index first, so a longer log makes reads slower, which keeps readers open longer.
The reproduction in forensics/test5_wal_checkpoints.py shows it cleanly. With one reader holding a snapshot, 500 writes grew the log to 6,735 KB, and a truncate checkpoint came back busy=1, 1,674 pages pending and 0 checkpointed. The moment the reader released, the same call returned busy=0 and the log dropped to zero bytes. In a separate local run, sustained writes beside two long-lived read transactions grew the WAL to 607 MB against a 19 MB database in three minutes; I recorded that number in database.py after the September hardening, and it is where my WAL limits came from.
What kept a reader open on the day? Measured in September, the uncached aggregate took about 5.2 seconds at p50 (33.8 requests per second), and I had put a 5 second cache in front of it with single-flight refresh. A refresh that takes about as long as the cache TTL means some reader is mid-query almost all the time, and the table it scans had grown to 46,238 result rows by event day. The leaderboard refresh is the long reader I would point to, and the test above is what such a reader does to the log.
forensics/ and run against a verified copy of the production database. The 61.3 ms figure uses a simplified AST comparison, so the real audit's cost may differ.Cause 3: six commits per match, and a lock with gaps#
Settlement in backend/app/db/elo_service.py loads the six bots, computes Elo deltas, then adds a MatchResult per bot. The version at the end of the day has await db.commit() inside the for loop. One match is therefore six separate write transactions: six acquisitions of the writer slot, six WAL appends and six syncs. Four matches ending together queue 24 transactions in a short window.
The lock itself had holes. db_write_lock is an asyncio.Lock that guards only code that opts in. After 12:54 and 13:34 it covered settlement, bot create, update, delete and champion changes, and the Forge submission commit. It did not cover the auth write until I removed that, and it cannot cover anything outside this process, such as a backup task or a manual query on the volume. It also has no relationship with SQLite's own lock: a session that flushes a statement outside the async with block takes the file lock first and the app lock never sees it. A mutex in one process queues callers in memory, which is better than racing at the file, but the real serialisation is still the file.
forensics/test6_full_workload.py, which replays the contended workload before and after the fixes.Cause 4: bot-similarity checks on the event loop#
When a contestant saved a bot, the handler also ran the plagiarism audit. It loaded every other contestant's champion, parsed and compared ASTs pair by pair, and wrote incidents, all inside the request. Python's asyncio runs one coroutine at a time; a loop of pure-CPU comparisons with no await in it stops every other request, WebSocket tick and timer until it finishes. The audit also held its database session open throughout, so it pinned a read snapshot for as long as it computed.
I measured 61.3 ms of CPU per submission against 50 scripts with a simplified comparison, and a heartbeat task recorded no ticks during it. Ten submissions in a burst is a 613 ms freeze, which looks to everyone else exactly like a database timeout.
Cause 5: a pool that hid the queue instead of removing it#
SQLAlchemy's default pool is 5 connections with 10 overflow. Fifty contestants with several tabs exhausted it quickly, and callers waiting on checkout failed after the default 30 second timeout. My response at 12:04 was to raise the pool to 50 plus 50 with a 15 second timeout, then at 13:51 to 100 plus 100 with 30 seconds. In the benchmark that was four times faster at checkout (1.75 s down to 0.43 s for 250 queries from 50 clients).
It also changed the failure shape. With aiosqlite every connection owns a worker thread. A pool of 200 means up to 200 threads, all contending for one write slot, and each blocked writer sleeps for up to busy_timeout, which I raised from 10 to 30 seconds at 13:34. A connection that waits 30 seconds for a lock is a connection no read can use for 30 seconds. I traded fast, visible pool errors for slow, silent queueing. The pool was never the bottleneck. It was a gauge for the real one: a single writer.
Cause 6: simulation and API in one process#
Everything above would have hurt less if the web tier had been separate from the game tier. It was not. The ladder scheduler launches matches in the same process that answers HTTP, so every bot step, JSON pipe and frame broadcast competes with every request for one interpreter. The CloudWatch numbers say it plainly: 12.5 percent on eight vCPUs is one saturated core, and the other seven were available but unreachable from a single event loop. The extra concurrency I added at 12:25, a default of 5 concurrent matches instead of 2, made this worse before my AIMD scheduler (throttle above 75 ms of p95 loop lag or 70 percent load, ramp below 35 ms and 50 percent) made it better. A scheduler that backs off under lag is the correct patch for the wrong architecture.
Why they compounded#
None of these is fatal alone. The chain is what mattered. Idle presence writes keep the writer slot warm, so settlement and Forge saves wait longer. Waiters keep connections, so the pool drains, so more requests queue at checkout. Slow reads keep snapshots open, so the WAL cannot shrink, so reads get slower. An AST audit freezes the loop, so the requests behind it arrive late and in bunches, and a bunch of requests is a burst of writes. Each cause raised the latency that fed the next, which is why fixing one at a time produced improvement without a clean recovery, and why the second CPU peak at 13:00 looked as bad as the first.
What I did on the day#
I worked down the list by cost and risk, deploying after each change and watching the leaderboard and Forge. The first moves treated symptoms: bigger pool, longer busy timeout, ladder throttling. The ones that mattered were removing the auth write, serialising settlement and saves, caching the leaderboard, settings and bot stats, and moving the audit off the request. The log in the timeline above is the sequence. Two further corrections came from the failure itself: the frontend now keeps the cached session through 5xx responses instead of logging a contestant out during a restart, and the ladder yields when live players are active.
Raise every limit and retry
Bigger pool, bigger busy_timeout, bigger ladder concurrency. It feels like progress because the error count drops. It trades loud failures for long waits and keeps the root cause, one writer behind one process, intact. This is what I did in the first hour.
Serialise writers inside the process, cache the reads
An asyncio.Lock around commits, short-TTL caches with single-flight refresh, read-only auth, background audits. The forensic runs show 0 lock errors and an order of magnitude lower p50. It holds for one process and about fifty users, and I would trust it for a repeat of this exact event. It does not survive a second worker, a second container or a bigger crowd.
Take the writer slot out of the design
Move durable state to Postgres, where row-level MVCC lets reads and writes proceed in parallel; push match results through a queue so a single consumer settles them in batches; keep leaderboard state in memory or Redis and refresh it when a result lands. This is what I will build next, below.
What was not the cause#
Ruling things out mattered as much as finding causes. The database file was intact: PRAGMA integrity_check and quick_check both returned ok on the post-event copy. The instance never failed a status check. The database sat on a Docker named volume with working POSIX locking, not on a bind mount, since the move on 12 September. The process count was one, so there was no cross-process file locking at all: all the contention was between connections inside a single process. And the simulations were never wrong; the final ranked tournament, 157 matches across 50 champions starting from a reset 1200 Elo baseline, completed once the fixes were in.
The architecture it should have had#
The fix I want is structural. State that has to be durable and concurrent goes to Postgres. Work that is slow and bursty goes behind a queue. The tier that runs untrusted bot code is isolated from the tier that serves pages. The API becomes stateless, so it can run as several workers, and session and matchmaking state moves to Redis so that "WEB_CONCURRENCY must be 1" stops being a rule.
(match_id, bot_id) rejects a replayed result, and a version column on ratings lets a retry detect a stale read instead of overwriting it.Browsers --> CDN (leaderboard cached at the edge, 10 s)
--> API workers (stateless, N copies)
|-- Postgres: users, bots, results (row-level MVCC)
|-- Redis: sessions, matchmaking, leaderboard hash
'-- enqueue match --> Redis stream
Simulation tier (CPU-bound, separate hosts, bwrap sandboxes)
claim match --> run bots in memory --> XADD result
Settler (single consumer)
claim batch --> ONE Postgres transaction --> ack --> refresh board
Rules
reads never write (presence goes to Redis, not users.last_seen_at)
one match = one message = one transaction
CPU work (AST audit) runs in a worker, never on the API loop
WAL checkpoints, busy_timeout and write mutexes: gone with SQLiteWhat I would change#
- Test with the real traffic shape. My load tests hit endpoints one at a time. The failure came from a mix of polling tabs, Forge saves and settlements together, which only
test6_full_workload.pymodels, and I wrote it after the event. - Watch the WAL and the loop from minute one. The runbook already says a monotonic climb in
sqlite_wal_bytesand p99 loop lag above 250 ms mean trouble. I had the metrics and did not have them on a screen during the event. - Take the audit out of the API process. A process pool for similarity, or a nightly batch, instead of on save.
- Fix settlement properly now. Move the commit back outside the loop and keep one transaction per match until the Postgres move.
- Define "read-only" in code review. No
commit()on a GET path.
Check your understanding#
Why did the platform have many users stuck on spinners while the CPU was pegged and matches were still finishing?
- The database file was corrupted, so only in-memory work succeeded.
- Matches run in memory and touch SQLite only at the edges, where all page traffic and settlement contended for one writer on one event loop.
- Traefik dropped connections to the game server.
- The instance failed its status checks and throttled.
In WAL mode, what does a long-lived read transaction do to the write-ahead log?
- It blocks all writers until it finishes.
- It makes the log write faster.
- It prevents the log from being checkpointed and reset, so the log keeps growing and reads get slower.
- It copies the log into the main file immediately.
The 12:54 change added an application-level asyncio.Lock around writes. What was its real limitation?
- It only serialises callers in one process and only the ones that use it, while SQLite's own file lock is still the real serialiser.
- It made SQLite support two writers.
- It replaced busy_timeout.
- It could only be used with Postgres.
Moving the plagiarism audit into asyncio.create_task sped up Forge saves. Why did it not fix the freeze?
- Tasks run in a separate process.
- Tasks are not allowed to touch the database.
- The audit had no CPU cost.
- The task still runs on the same event loop, and its comparison loop has no await or thread offload.
Which change would remove the single-writer contention by design, rather than manage it?
- Raising busy_timeout to 60 seconds.
- Raising the pool to 500 connections.
- Moving durable state to Postgres and settling match results through a queue with one batched transaction per match.
- Running a second Uvicorn worker on the same SQLite file.